
February 25, 2025
This report describes a system consisting of an Arduino, a stepper motor, and an ultrasonic sensor used to map the distances of a surrounding testing area over 360\(\degree\). Despite issues typical of ultrasonic sensing, the system was capable of faithfully reproducing a map of the room after it was fully calibrated. Furthermore, the sensor provided insights into the effective radius of the ultrasonic wave emitted at certain distances. This system demonstrates ultrasonic sensing as an attractive option for robotics prototyping, due to low costs and high reliability.
Distance detection is a very important aspect of numerous electronics systems. In fields such as robotics, distance sensors are often required for systems to operate properly, as precise measurements are essential for robots to map out their surroundings, avoid collisions, and navigate through complex obstacles. Specifically, distance detection at multiple angles is oftentimes necessary, otherwise robots may make flawed decisions when determining the optimal turning direction in the presence of obstacles.
While there are many ways to achieve distance detection, such as LiDAR (light detection and ranging) or infrared sensors, one cheap and effective method is an ultrasonic sensor. For robotics projects with limited funding and resources, ultrasonic sensors are an effective method for distance measurement, even though other methods may give more accurate results. Ultrasonic sensors are also designed to easily interface with Arduino boards, making them optimal for robotics prototyping.
Ultrasonic sensors essentially work by emitting a high frequency sound wave pulse, then recording the amount of time it takes for a reflected sound wave to be detected. Internally, this works by driving a piezoelectric crystal in the transmitter of the device with a high frequency, oscillating voltage. The receiver, also a piezoelectric crystal, converts the sound wave back into a voltage signal, which is detected by the internal circuitry of the sensor. Then, using the speed of sound, the flight time of the emitted wave is converted to a distance using the following formula: \(d = t\cdot0.0343/2\), where we account for the fact that the sound wave actually has to travel twice the distance that was desired to be measured\(^{[3]}\).
Despite the complicated internal circuitry, the sensor remains cheap at less than four USD, making it optimal for robotics prototyping or demos. Furthermore, the small form factor of the device makes it extremely flexible for use with motors, enabling detection that can cover an entire 360 deg field of view, which is the main aim of this project.
Ultrasonic sensors do have some limitations. Since signal detection depends on the strength and quality of the reflected wave, object detection will always depend on how well the sound wave is reflected. Thus, objects that are slanted, rough, or absorb sound waves well will have much weaker signals, introducing noise into the measurement and possibly returning incorrect distances. Another subtle issue is that the sensor will always return the distance corresponding to a reflection from the closest object, regardless of whether that object is in the same area the sensor points towards, a quality which we deem the "nearest object" effect. Since the sound wave is really a plane wave that emerges from the sensor, objects that are not directly in front of the sensor can generate reflections that can give incorrect results for distance. This result will be seen prominently in the data that was collected. Perhaps the main challenge that emerged was the actual attachment of the sensor to the motor. With more sophisticated construction techniques, it should be possible to mount the sensor more securely, however.
In summary, this paper examines the use of an ultrasonic sensor and motor set up to get multi-angle distance measurements. This work aims to demonstrate the ultrasonic sensors as a very reliable, yet cheap and easy option for sensing in robotics.
In order to build a prototype multi-angle distance sensor, several components needed to be acquired. On top of the Sparkfun HC- SR04 ultrasonic sensor itself, an Arduino Uno Rev3, an Adafruit Motor Shield v3, and an Adafruit NEMA-17 stepper motor were needed.
The first challenge lay in the connection and calibration of the ultrasonic sensor. This required the Arduino board to be interfaced to a laptop using a USB B to C cable. Once the board is connected, users are able to upload small programs to the board that can be written in the Arduino IDE, which is free for download on the internet. Fortunately, due to the popularity of the Arduino, there are many tutorials online explaining how to use and program both the ultrasonic sensor and motor, two of which were used in this project \(^{[1,2]}\).
With the HC-SR04 ultrasonic sensor, the user simply has to provide a 10 \(\mu s\) pulse to the trigger pin on the device. The integrated circuitry in the ultrasonic sensor then provides a 40kHz oscillating voltage signal to the transmitter, which emits the sound wave. The receiver then converts the reflected wave back into a voltage signal, which is detected by the internal circuitry of the sensor. The echo pin then emits a voltage pulse that lasts the duration of the in flight time of the sound wave.
The Arduino was connected to the echo and trigger pins of the sensor, also connecting the Arduino’s 5V and ground. Using the Arduino IDE, the trigger pin was sent a 10\(\mu s\) pulse at 5V. The Arduino was then programmed to listen for a response pulse from the echo pin and measure its duration. Once the sensor was working properly, the device was calibrated by measuring distances at intervals of 10 cm. The differences from the true values were then analyzed using a curve fitting method from the scipy.optimize package.
One main challenge in this study concerned the stepper motor. While the motor can, in principle, be directly connected to the Arduino, the large current requirements for the motor present a danger to the Arduino and laptop. Thus, an Adafruit Motor Shield v3 was used to interface with the stepper motor. Since the motor shield is actually inserted into the Arduino such that it rests on top of it, the motor shield both protects it, and allows easy access to the pins of the Arduino. Due to the difference in power supply requirements for the Arduino and stepper motor, the motor shield and motor were powered separately using a 12V wall adapter, which plugged into the DC jack on the Arduino. Importantly, the power jumper was placed over the two VIN jumper pins to prevent a shorting from the power supply.

The stepper motor was then wired to the M3 and M4 terminals of the motor shield. The Adafruit NEMA-17 stepper motor is a four connection bipolar stepper motor. In general, a bipolar stepper motor works by alternating the current direction through two internal electromagnets. The phase difference between the fields produced by the two electromagnets causes the permanently magnetized rotor to orient itself along the internal magnetic field, which can be changed in small steps by the internal circuitry of the motor. In practice, the motor is designed to be interfaced with the motor shield of the same brand and packages that can be downloaded in the Arduino IDE make controlling the motor extremely simple\(^{[4]}\).
The sensor was then attached to the motor to enable multi-angle sensing. This was perhaps the most challenging part of the project. While the rigidity of the sensor-motor system can be unimportant over small angle intervals, with 360\(\degree\) mapping, rigidity becomes very important for ensuring accuracy in the angle of each measurement. For instance, if the sensor is able to slip a small amount while rotating, the angle the Arduino reports a measurement at can be vastly inaccurate. While many options were explored to resolve this such as glue, rubber cement, and string, the solution that worked the best was simply duct tape wrapped very tightly around the sensor base, wiring, and the rotor. The main reason the attachment of the sensor had to be so rigid turned out to be the resistance to twisting from the wires needed to connect the sensor to the Arduino. To solve this issue, the wires were attached with tape to the ceiling of the wooden box the sensor rested in, preventing them from catching on the corners of the motor during rotation and allowing twisting with the least amount of resistance. The set up is pictured in Fig 2E. After every scan, the sensor was rotated back 360\(\degree\) to minimize twisting resistance.
Finally, the sensor was used to map a small wooden box in an approximately \(11\times11\) foot room. The box, which is open on two sides, offers an opportunity for the sensor to attempt to detect both short and long distances in each scan. An approximate diagram of the room is provided in Fig 1.
The distance data was analyzed real time by the Arduino. The sensor was either revolved at 1.8\(\degree\) per step or 3.6\(\degree\) per step, for a total of 200 and 100 steps per revolution in total. For most runs, extra steps were taken to ensure that the sensor completed the full 360\(\degree\) rotation. The angle of each measurement was then slightly adjusted to account for the extra steps needed to reach a full revolution. For each angle, twenty measurements were performed from which a mean, standard deviation, and standard error of mean were calculated.
The first experiment run concerned the calibration of the device. Measurements were taken in increments of 10 cm, from 10 to 150 cm. For each distance, 100 measurements were taken, from which a mean and standard deviation were calculated.
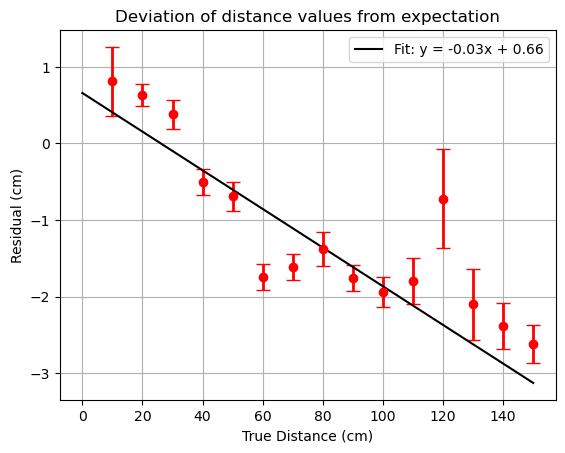
Figure 3 demonstrates how the sensor consistently underestimates for increasing distances. Using this data, a calibration curve was generated using a linear regression method from the scipy.optimize package. Finally, the curve was used to correct the data taken in this study, with the error in the calibration curve constants being propagated through to the error in the final distance estimates.
Next, the test room was mapped, as shown in Fig 4a. Of note are the two walls of the wooden box which the sensor rested inside, the table across the room from the sensor, the doorway, and finally, a complex experimental apparatus for studying the Zeeman effect that lies along the right wall.

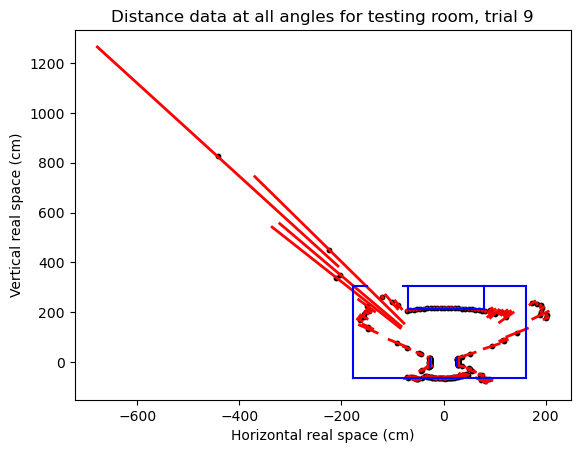
There are several aspects of this data to note. First, there are some obvious inconsistencies between the sensor and real space. Sharp corners of objects continually represent an issue for the ultrasonic sensor, with the returned value usually averaging to half the distance between the edge and the wall behind with a large variance, an issue which seems to be unresolvable and simply a quality of the sensor.
Another issue is that the sensor consistently measured (unfortunately, over many trials) distances beyond the walls of the room. One possible explanation for this stems from the nature of the sound waves being used. Specifically, in the area around the Zeeman apparatus in the top right corner, it is believed that the complex geometry of the set up is preventing the sound waves from being reflected back directly. This means that the reflected pulse that is detected when the detector is pointing in this direction may have been reflected multiple times off other objects in the room, making the distance to the Zeeman apparatus appear much larger than reality. This issue highlights another problem typical of the ultrasonic sensor: the requirement of good reflectors for quality measurements.
One major triumph of the experiment was the ability of the sensor to detect the hallway beyond the doorway in the top left. Though this signal had an extremely large error, it sits right in the correct range for the wall on the opposite side of the hallway. Furthermore, this measurement provides an insight into a possible estimate of the width of the sound wave emanating from the transmitter, a topic which will be elaborated upon shortly.

Perhaps the most interesting aspect of the data concerns the “nearest object” effect. While the sensor was extremely effective at detecting the edge of the table at the top of Fig 4a, we noticed a slight bowing effect on the data collected in this region. While logically the measurements in this region should follow the straight edge of the table, instead they appear part of a larger arc of a circle. This is due to what we have deemed the “nearest object” effect: the ultrasonic sensor will always return the distance which requires the emitted sound wave to travel the shortest distance. Thus, even if the sensor is angled relative to the table, it will still return the distance perpendicular to the table. This is because a part of the sound wave reaches the center of the table before the rest of the wave reaches the area in line with the sensor’s true orientation. This is why the distances around the table appear bowed: the sensor is reporting the distance perpendicular for many different angles relative to the table. This effect allows a unique opportunity to examine how large the emitted wave actually is, giving insight into how effective the device can be at detecting objects not directly in front of it. To the left and right of the table, two points were selected where this bowing effect last reliably occurred, as shown in Fig 5. From this an angle was calculated, representing the last point at which the sensor still reported the perpendicular distance to the table. This arc length was taken to be an estimate of the radius of the sound wave as it passed the table, and was calculated to be: \[s=r\cdot\theta\approx 93.91 \pm 0.54\text{ cm }\]
The main goal of this study was to use an ultrasonic sensor to map out a wooden box and testing room set up, which was partially successful. The experimental setup was capable of faithfully reproducing many aspects of the testing area. There were, however, numerous issues with the mapping, mainly stemming from characteristics of the ultrasonic sensor. For instance, the fact that the sensor uses the reflection of sound waves to detect distances can introduce incorrect measurements due to the “nearest object” effect.
Despite drawbacks, the ultrasonic sensor and stepper motor system has proven to be an attractive option for robotics applications, especially in the early design and prototyping stage. Specifically, for robots that need to path find through complex spaces, ultrasonic sensors and stepper motors can be effectively used to not only detect obstacles in front of robots, but help determine which direction the robot should turn.
While the setup works well, there are several improvements that could be made. One obvious improvement concerns the mounting of the sensor on the motor. As mentioned before, the current mounting method results in the true sensor angle lagging behind the recorded angle due to slippage, requiring angle data to be corrected. In future iterations of this device, the sensor could be soldered onto the motor or even machined to ensure a good fit with high rigidity. Additionally, braided wires could be used to connect the ultrasonic sensor, which would give less resistance during twisting. Another possible refinement could involve focusing the sound wave emitted from the sensor. Extending the metal cylinder that surrounds the internal piezoelectric could reduce the radius of the emitted wave, enabling more accurate sensing. Additionally, this behavior could be modeled as a wave guide to more accurately predict the behavior of the emitted wave.
In the course of this project, several key skills were acquired. The Arduino itself is a highly versatile platform optimal for conducting physics experiments. Learning how to use the system is undoubtedly extremely helpful to anyone pursuing a career in experimental physics. Learning how to design a system such as this is also a significant skill in and of itself. As is so often the case in experiments, designing an experimental apparatus takes time, effort, and significant patience. Lastly, understanding the mechanics of sound waves and the complex ways in which they can reflect and give strange distance measurements is useful for future experiments with other types of waves.
The author acknowledges the help of Dr. Kevin Labe in acquiring the numerous materials needed for this project. Additionally, Walter Chavarria offered helpful suggestions towards experimental analysis.